The first instinct is that the machine has run out of memory. Usually it has not, and the number people check to decide that is the wrong one.
Used memory is not the problem indicator
macOS deliberately keeps memory occupied. Free RAM does nothing useful, so the system fills it with caches and compressed pages and releases them when something needs the space. A Mac showing memory almost fully used is a Mac behaving correctly, and screenshots of that number cause a great deal of unnecessary worry.
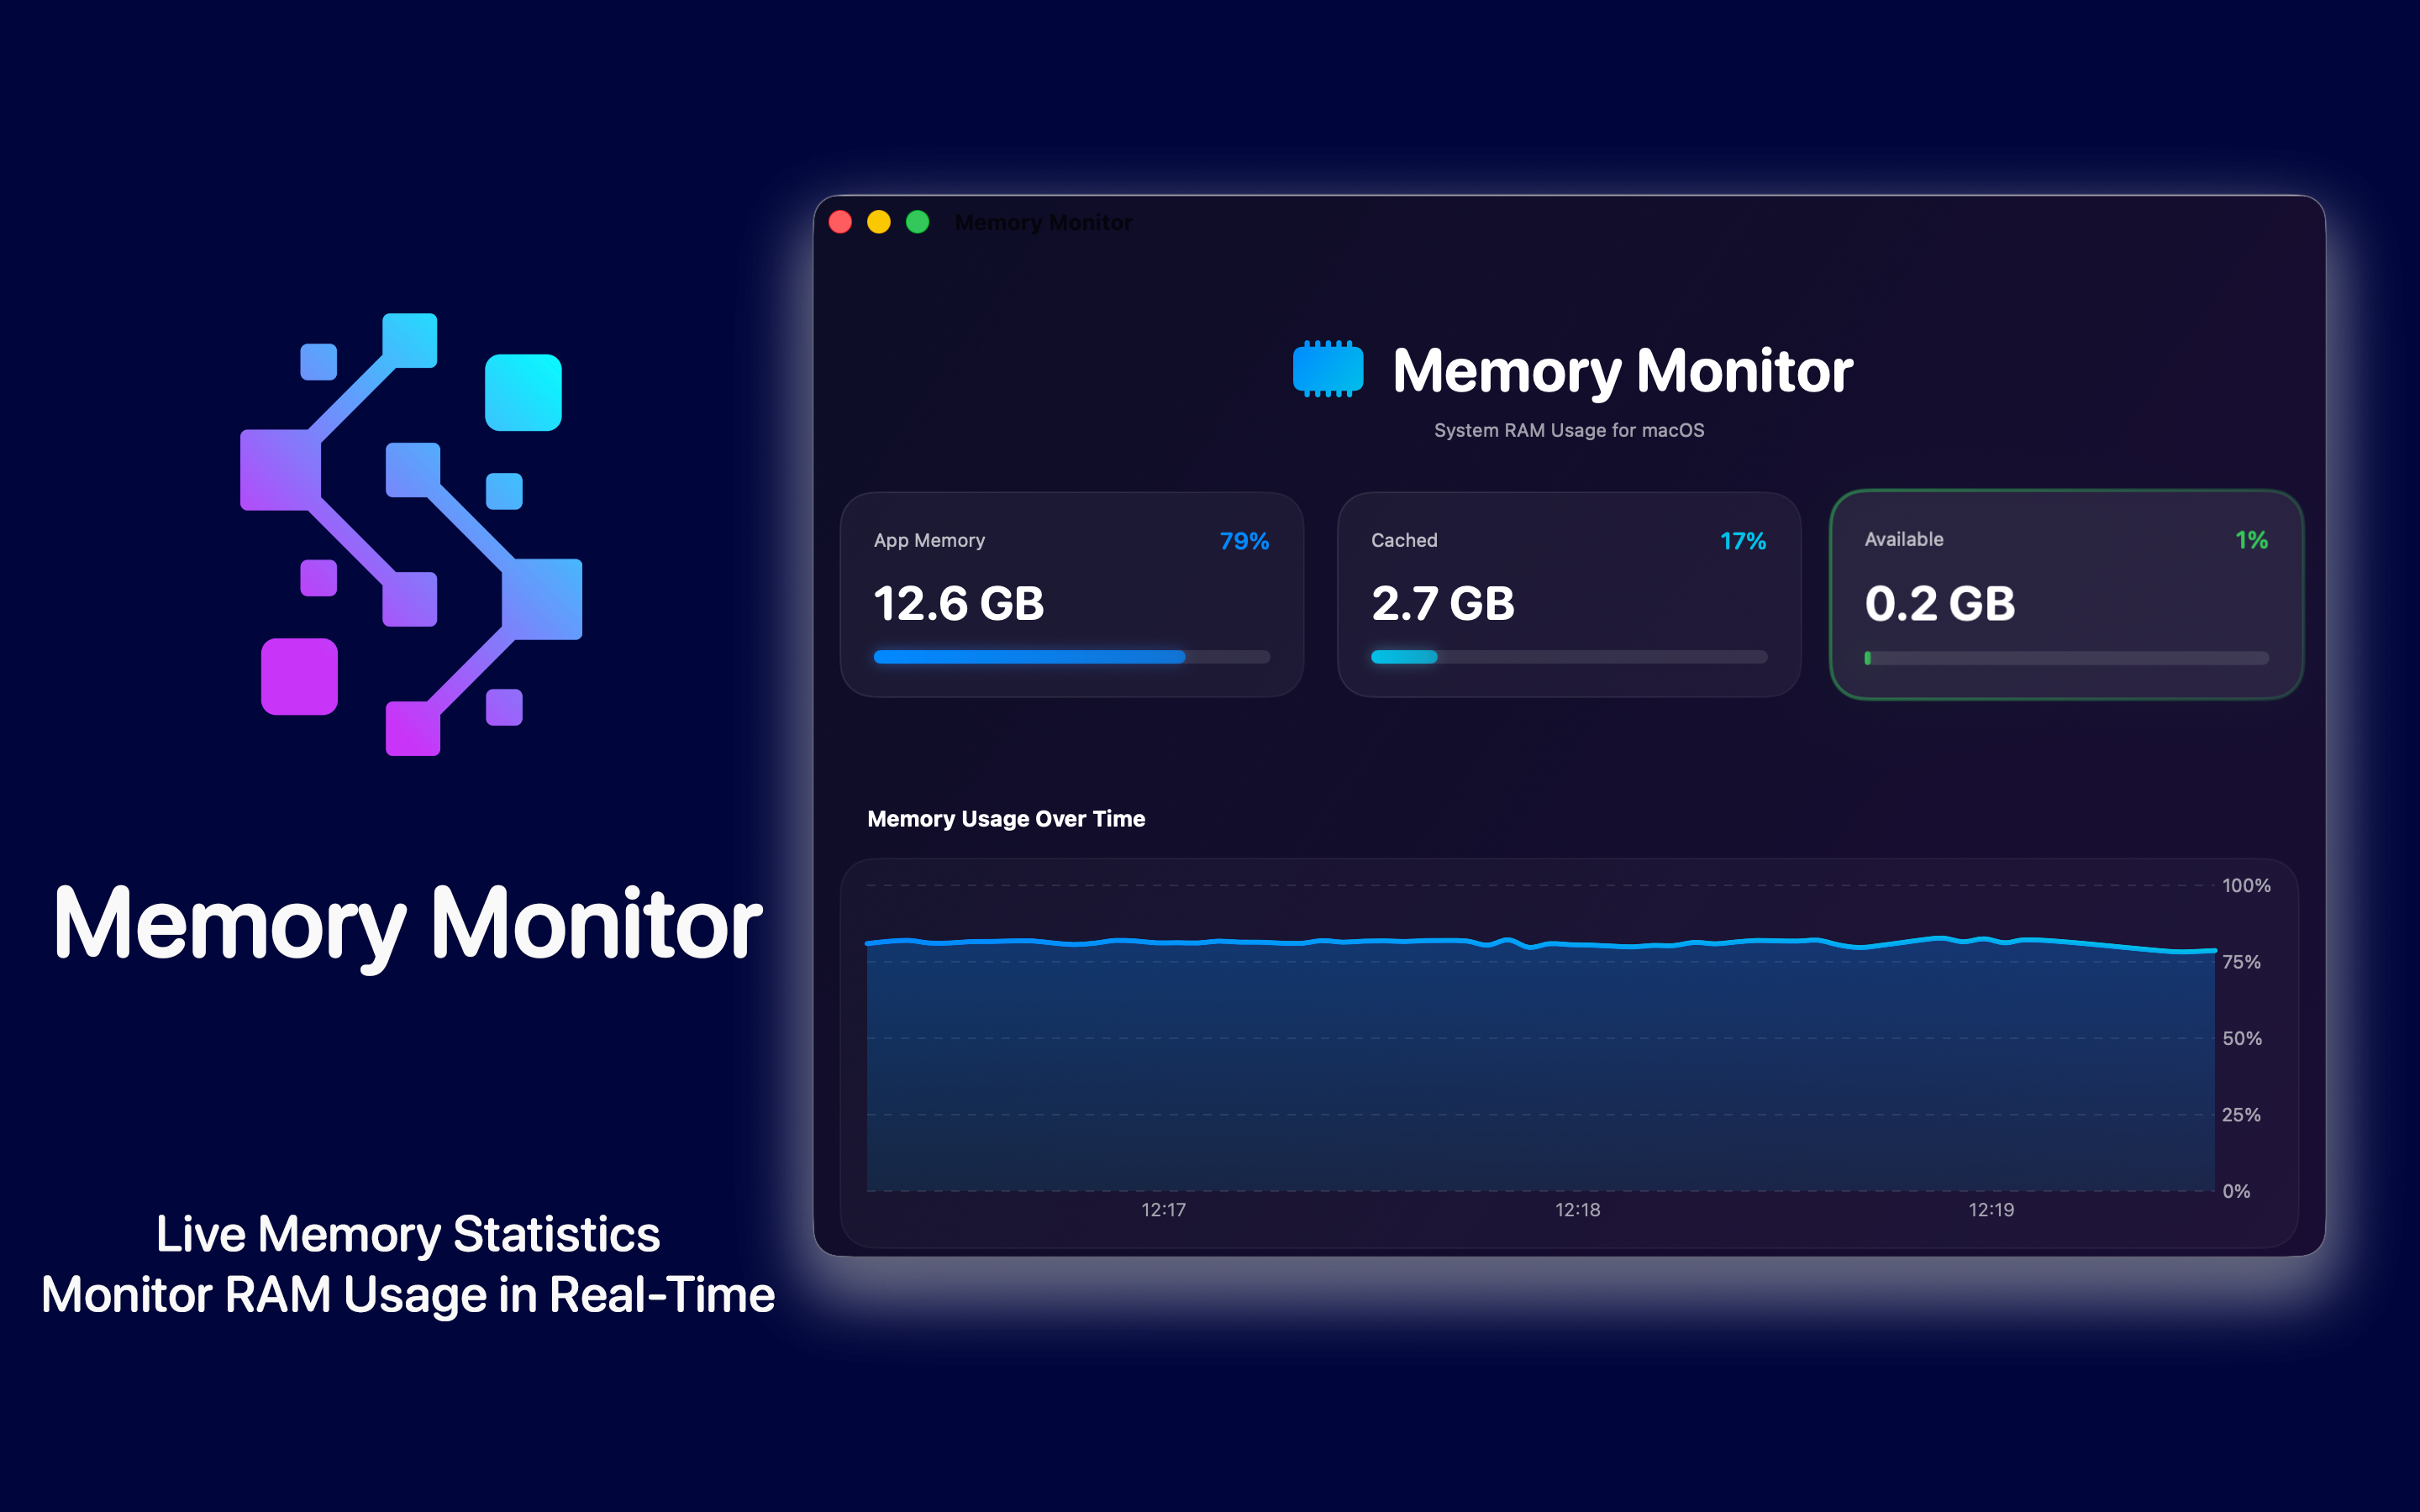
The figure that matters is memory pressure. Green means the system is comfortable regardless of how full the bar looks. Yellow means it is working to keep up. Red means it is swapping, and swapping is where the responsiveness goes.
What a batch export actually does
Each image gets decoded from its compressed form into a full uncompressed bitmap in memory. A 24-megapixel photo is roughly 96 MB once decoded at 8 bits per channel, more if the pipeline works in 16-bit. Process eight in parallel and the working set is close to a gigabyte before any of the actual work has happened.
Most export tools size their parallelism from the core count, which on a machine with many cores and modest memory produces exactly the wrong ratio. The fans are responding to genuine CPU load; the stuttering is memory pressure underneath it.
What actually helps
- Reduce concurrency. If the tool exposes a thread or batch-size setting, halving it often costs little wall-clock time and removes the pressure entirely.
- Split the job. Four runs of fifty beats one run of two hundred, and it also gives you a place to stop if something is wrong with the settings.
- Quit the browser. Not folklore in this specific case - a browser with many tabs is often the largest single block of memory on the machine, and a batch job is exactly when you are not using it.
- Watch which process is growing. If one keeps climbing across a long run rather than plateauing, that is a leak, and no amount of RAM fixes it.
When more memory is the honest answer
If pressure sits in the yellow or red during ordinary work rather than only during batch runs, the machine is genuinely undersized for what you do. That is a purchase decision rather than a tuning one, and worth making on a week of observation instead of one bad afternoon.
Apple silicon complicates the arithmetic because memory is shared with the GPU, so a graphics-heavy pipeline consumes from the same pool. The practical effect is that the comfortable figure for photo and video work is higher than the equivalent used to be.